Kausal: Transform observability.
Don’t lose precious minutes during incident response. Seamlessly switch between metrics, logs and traces, preserving context, saving time.
Kausal combines Prometheus monitoring, log aggregation and OpenTracing compatible distributed tracing into a hosted observability service for developers. It is targeted towards Kubernetes deployments but can easily be adapted to any system already using Prometheus.
Pricing
Prometheus
- Long-term storage of Prometheus data
- Grafana Integration
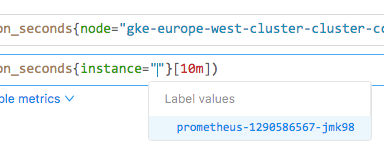
- Intelligent Query Completion
- 13 months metric retention
- 8x5 support
Developer
- Long-term storage of Prometheus data
- Grafana Integration
- Intelligent Query Completion
- 13 months metric retention
- 8x5 support
- Log aggregation
- Distributed tracing
- 14 day log and trace retention
- Long-term storage of Prometheus data
- Grafana Integration
- Intelligent Query Completion
- Log aggregation
- Distributed tracing
- Up to unlimited retention
- On premise deployment
- 24x7 support
Example:
The Prometheus Node Exporter by default exports ~1000 time series; scraped at 15 second intervals, this would send 66 samples a second to us and use 1000 time series, per node. Therefore for a 50 node cluster you would pay $280/month.
Features
Prometheus-as-a-Service
- Hosted, highly-available Prometheus as a Service
- Virtually-infinite retention of your Prometheus metrics
- Intuitive query interface with tab-completion of metrics, labels, and histograms
- Parallel query execution - get faster, Prometheus-powered dashboards
- Easy configuration - point your Prometheus instance at Kausal with one entry
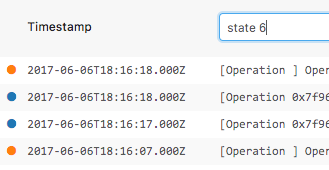
Log Aggregation
- Hosted, highly-available log retention
- Use Prometheus-style index and selectors to filter logs
- Seamlessly switch between metrics and logs in a single UI, preserving context
- Combine log entries and time series via regular expression matching.
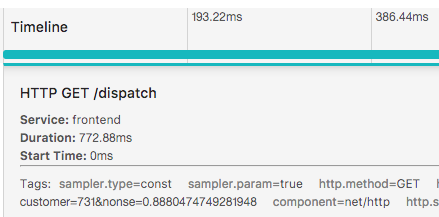
Distributed Tracing
- Hosted, highly-available distributed tracing
- Centrally collect, store and analyse distributed traces.
- Seamlessly switch between metrics, logs and traces in a single UI, preserving context
For more information about our features please read our FAQ.
Integration & Use Cases

Prometheus
Prometheus is a timeseries database with a powerful query language. Kausal’s metrics component acts as a remote storage facility for Prometheus data. This allows for long-term retention of timeseries.
Opentracing
OpenTracing is a set of APIs designed to abstract away the instrumentation of your application from the implementation of the distributed tracer. This allows projects to adopt distributed tracing instrumentation without having to choose a vendor, and enables new tracing implementations (like Kausal) to enter the world more easily!


Kubernetes
Prometheus and Kubernetes are like brother and sister: both inspired by Google’s technology, they are built around the concept of first-class labels and selectors. Kausal extends this to log aggregation and distributed tracing, making Kausal the first choice for observability on Kubernetes.
Services
Consulting
Need help deploying and configuring Prometheus?
Want someone to instrument your applications for you?
Kausal can help with bespoke consulting packages.
Support
Want someone at the end of the phone when things go south?
Need to bounce Prometheus questions off experts?
Kausal support will be there for you.
Training
Need to train your team on monitoring best practices? Want to learn how to write PromQL queries?
Kausal's training packages can show you how.